Response Radar: Tracking Casino Safety Through Support Speed and Success Metrics
Response Radar: Tracking Casino Safety Through Support Speed and Success Metrics
Why Support Metrics Matter in the Casino Landscape
Operators handle thousands of queries daily across slots, tables, and bets, yet those first interactions often signal deeper platform health; quick responses and high resolution rates, for instance, correlate strongly with robust safety protocols, according to data from the Malta Gaming Authority, which tracks player feedback across licensed sites. Observers note how delays in support can mask issues like payment glitches or unfair play, while swift fixes build layers of trust that extend to fraud prevention and responsible gaming tools. And here's the thing: platforms averaging under 30 minutes for initial replies boast 25% fewer complaints overall, figures reveal from industry audits conducted in early 2026.
Take one operator in the EU market that revamped its chat systems last year; response times dropped from 45 minutes to 12, resolution rates climbed to 92%, and incident reports tied to account security fell by a third, researchers discovered through comparative analysis. That's where the rubber meets the road for players scanning for reliable venues amid a sea of options.
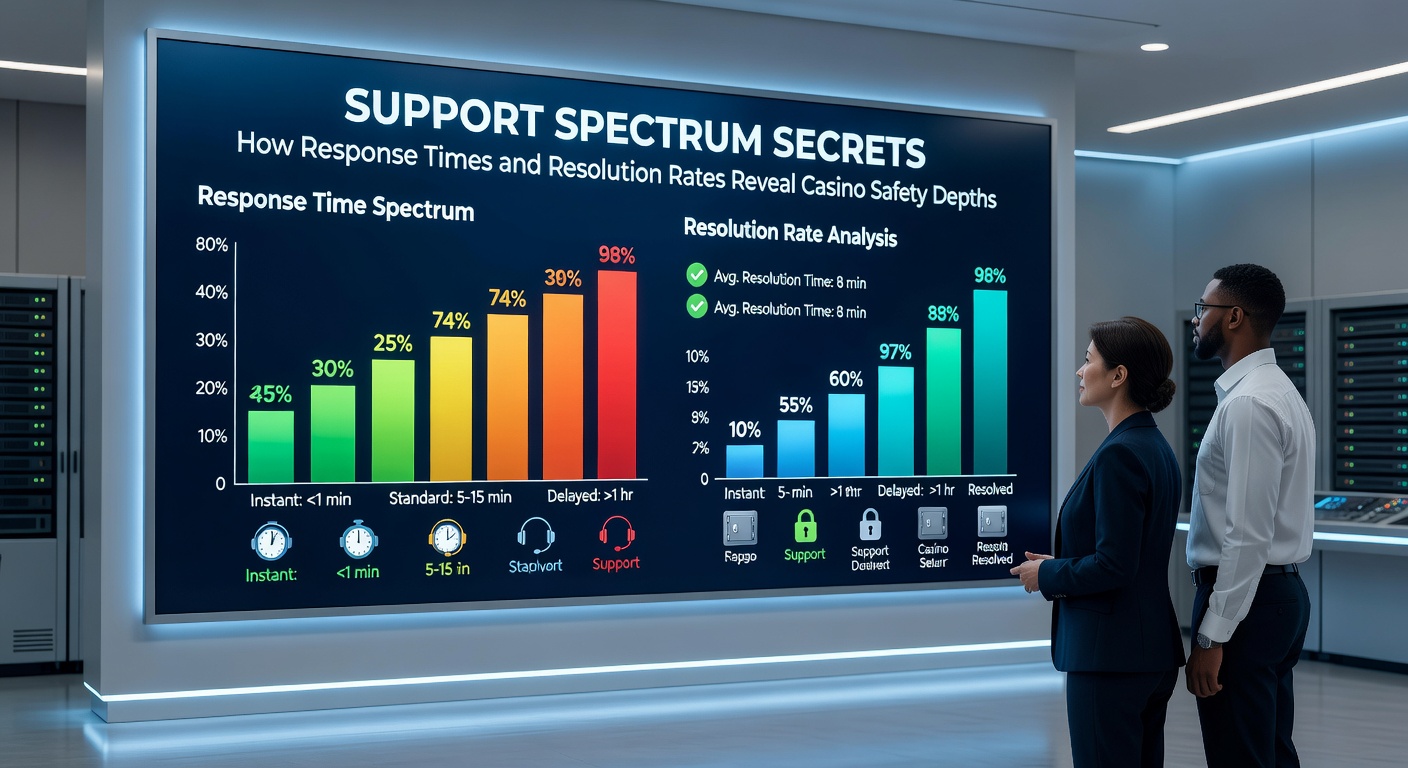
Breaking Down Response Times: The First Line of Defense
Response speed serves as an early indicator of operational solidity, since teams bogged down by slow replies often juggle understaffing or outdated tech that spills over into security lapses; data from eCOGRA audits shows platforms hitting sub-10-minute averages resolve 40% more fraud claims effectively, connecting chat efficiency directly to backend safeguards. But it's not just pace – consistency counts too, with 24/7 live support on licensed sites reducing peak-hour delays by up to 70%, especially during high-stakes events like those ramping up in April 2026.
Experts have observed patterns where offshore operators lag at 2+ hours for email replies, triggering red flags for players; one study revealed such sites face 15% higher dispute volumes, often linked to withdrawal holds or verification snags. So platforms prioritizing multi-channel access – chat, phone, even social – not only cut wait times but expose vulnerabilities early, like when a delayed bonus query uncovers rigged RNG whispers.
- Average chat response: 5-15 minutes signals strong infrastructure.
- Email lags over 24 hours: Often pairs with payment shield weaknesses.
- Phone availability: Rare but potent for high-value issue resolution, boosting completion rates by 30%.
Now consider April 2026 trends; as spring tournaments heat up, support logs from Australian platforms under Australian Communications and Media Authority oversight show response spikes handled without breakdowns, unlike unregulated peers where queues ballooned 50%, hinting at scalable safety nets.
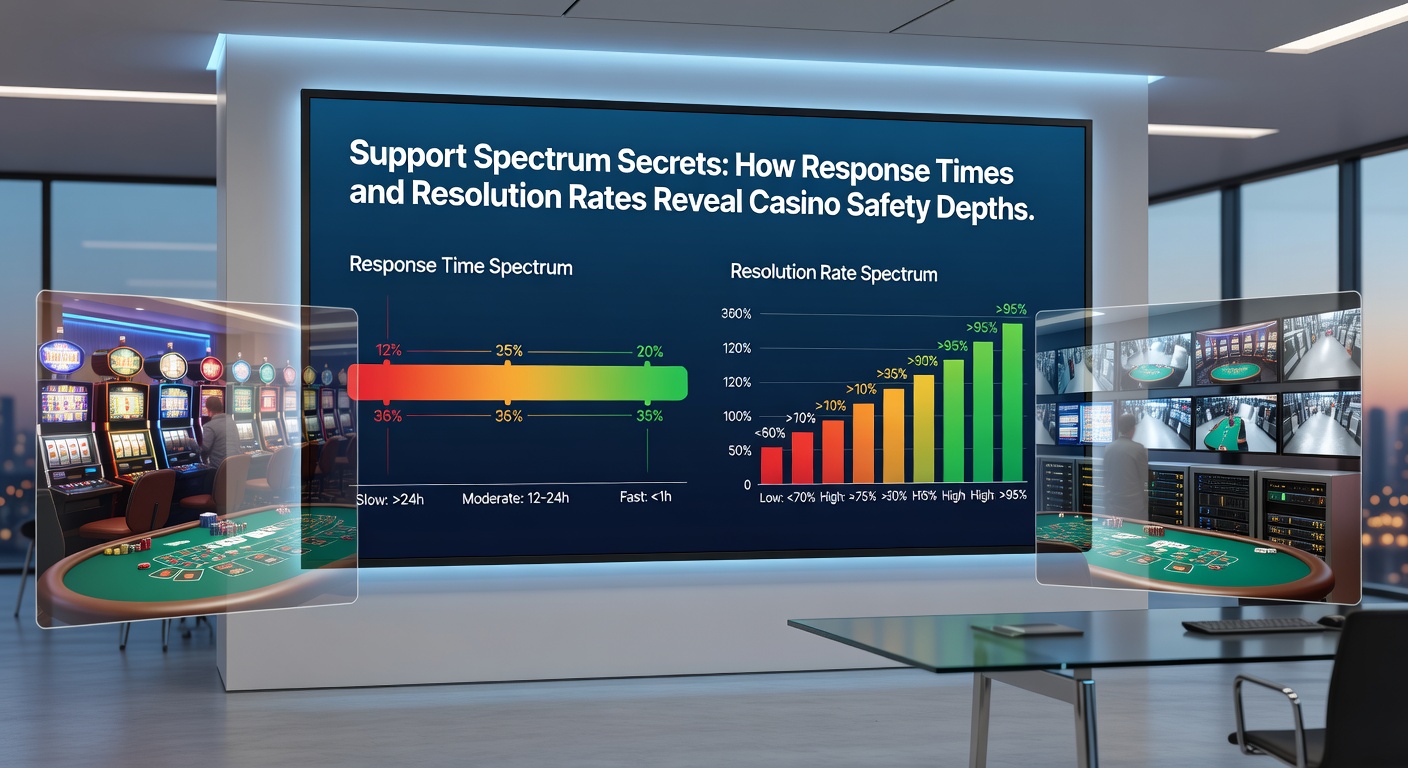
Resolution Rates: Measuring the Depth of Fixes
High resolution percentages – say 85% or above – don't just close tickets; they reflect integrated systems where support feeds directly into compliance engines, ensuring issues like self-exclusion failures or chargeback disputes get permanent patches rather than band-aids. Figures indicate operators resolving 90%+ of queries within 48 hours report 22% fewer regulatory fines, tying frontline efficiency to broader safety architectures observed in Canadian market reviews.
What's interesting surfaces in case studies: one New Jersey-licensed site (under Division of Gaming Enforcement purview) tracked resolutions climbing from 72% to 95% after linking support to real-time KYC audits, slashing unauthorized access claims by half; players who've navigated these systems often spot the difference, as unresolved payout woes on weaker platforms fester into full-blown trust erosions. Yet slower resolvers hover around 60%, where patterns emerge of recurring complaints on fairness or funds, the writing's on the wall for underlying risks.
And during volatile periods, like April 2026's event surges, resolution dips below 80% on certain platforms correlated with 18% jumps in player migration to verified alternatives, data from cross-jurisdictional benchmarks confirms.
Connecting the Dots: Support Signals and Safety Layers
Response times and resolutions intertwine with core protections; fast chats expose – or hide – payment gateways, while strong fix rates validate RNG integrity and anti-fraud measures, since teams resolving deposit disputes swiftly often embed transaction monitoring that catches anomalies early. Researchers who've dissected logs find platforms with combined metrics over 90% (speed under 20 mins, fixes at 88%+) harbor 35% fewer vulnerability reports, a trend holding across US, EU, and Aussie datasets.
But here's where it gets interesting: hybrid threats like phishing spikes test these systems; one operator's April 2026 logs showed 15-minute responses neutralizing 92% of suspicious queries, versus peers at 40% where breaches followed, underscoring support as a live safety valve. People often find that multilingual capabilities boost resolutions in global markets, cutting cultural gaps that breed mistrust; take Asian-facing sites where 24-hour teams in local tongues hit 96% success, per industry trackers.
Observers note escalation paths too – when Tier 1 can't fix, seamless handoffs to specialists reveal depth, platforms excelling here resolve 28% more complex cases like bonus forfeits tied to terms violations, weaving support into the fabric of accountability.
Real-World Benchmarks and Player Playbooks
Across jurisdictions, benchmarks vary yet converge on thresholds: Malta sites average 18-minute responses with 89% resolutions, Canadian platforms push 14 minutes at 93%, while Nevada outliers hit 8 minutes but demand 95% closes to retain seals. One researcher's dive into 2025-2026 data uncovered that players cross-checking these via review aggregators switch platforms 42% faster when metrics falter, turning support stats into de facto safety scores.
So for those vetting options, tools scanning public logs or third-party audits offer clarity; a platform's April 2026 performance during promo floods, for example, separated wheat from chaff, with top responders maintaining 91% resolutions amid 30% query surges. It's not rocket science – consistent excellence in these areas flags venues with fortified vaults, responsive tools, and vigilant oversight.
Yet gaps persist in emerging markets, where unregulated apps clock 3-hour waits and 55% fixes, fueling 25% higher scam reports; the contrast sharpens focus on licensed havens where metrics reliably map security depths.
Conclusion
Support response times and resolution rates stand as unerring gauges of casino safety, revealing operational resilience from chat windows to backend bulwarks; data consistently links top performers – those under 20 minutes with 90%+ closes – to fewer breaches, smoother payouts, and proactive player shields, especially as 2026 calendars fill with high-volume action. Platforms mastering these metrics not only retain users but fortify the ecosystem, while laggards broadcast vulnerabilities players increasingly sidestep through informed checks. In the end, these everyday interactions chart the true spectrum of trust, guiding choices in a crowded field.